05Nov
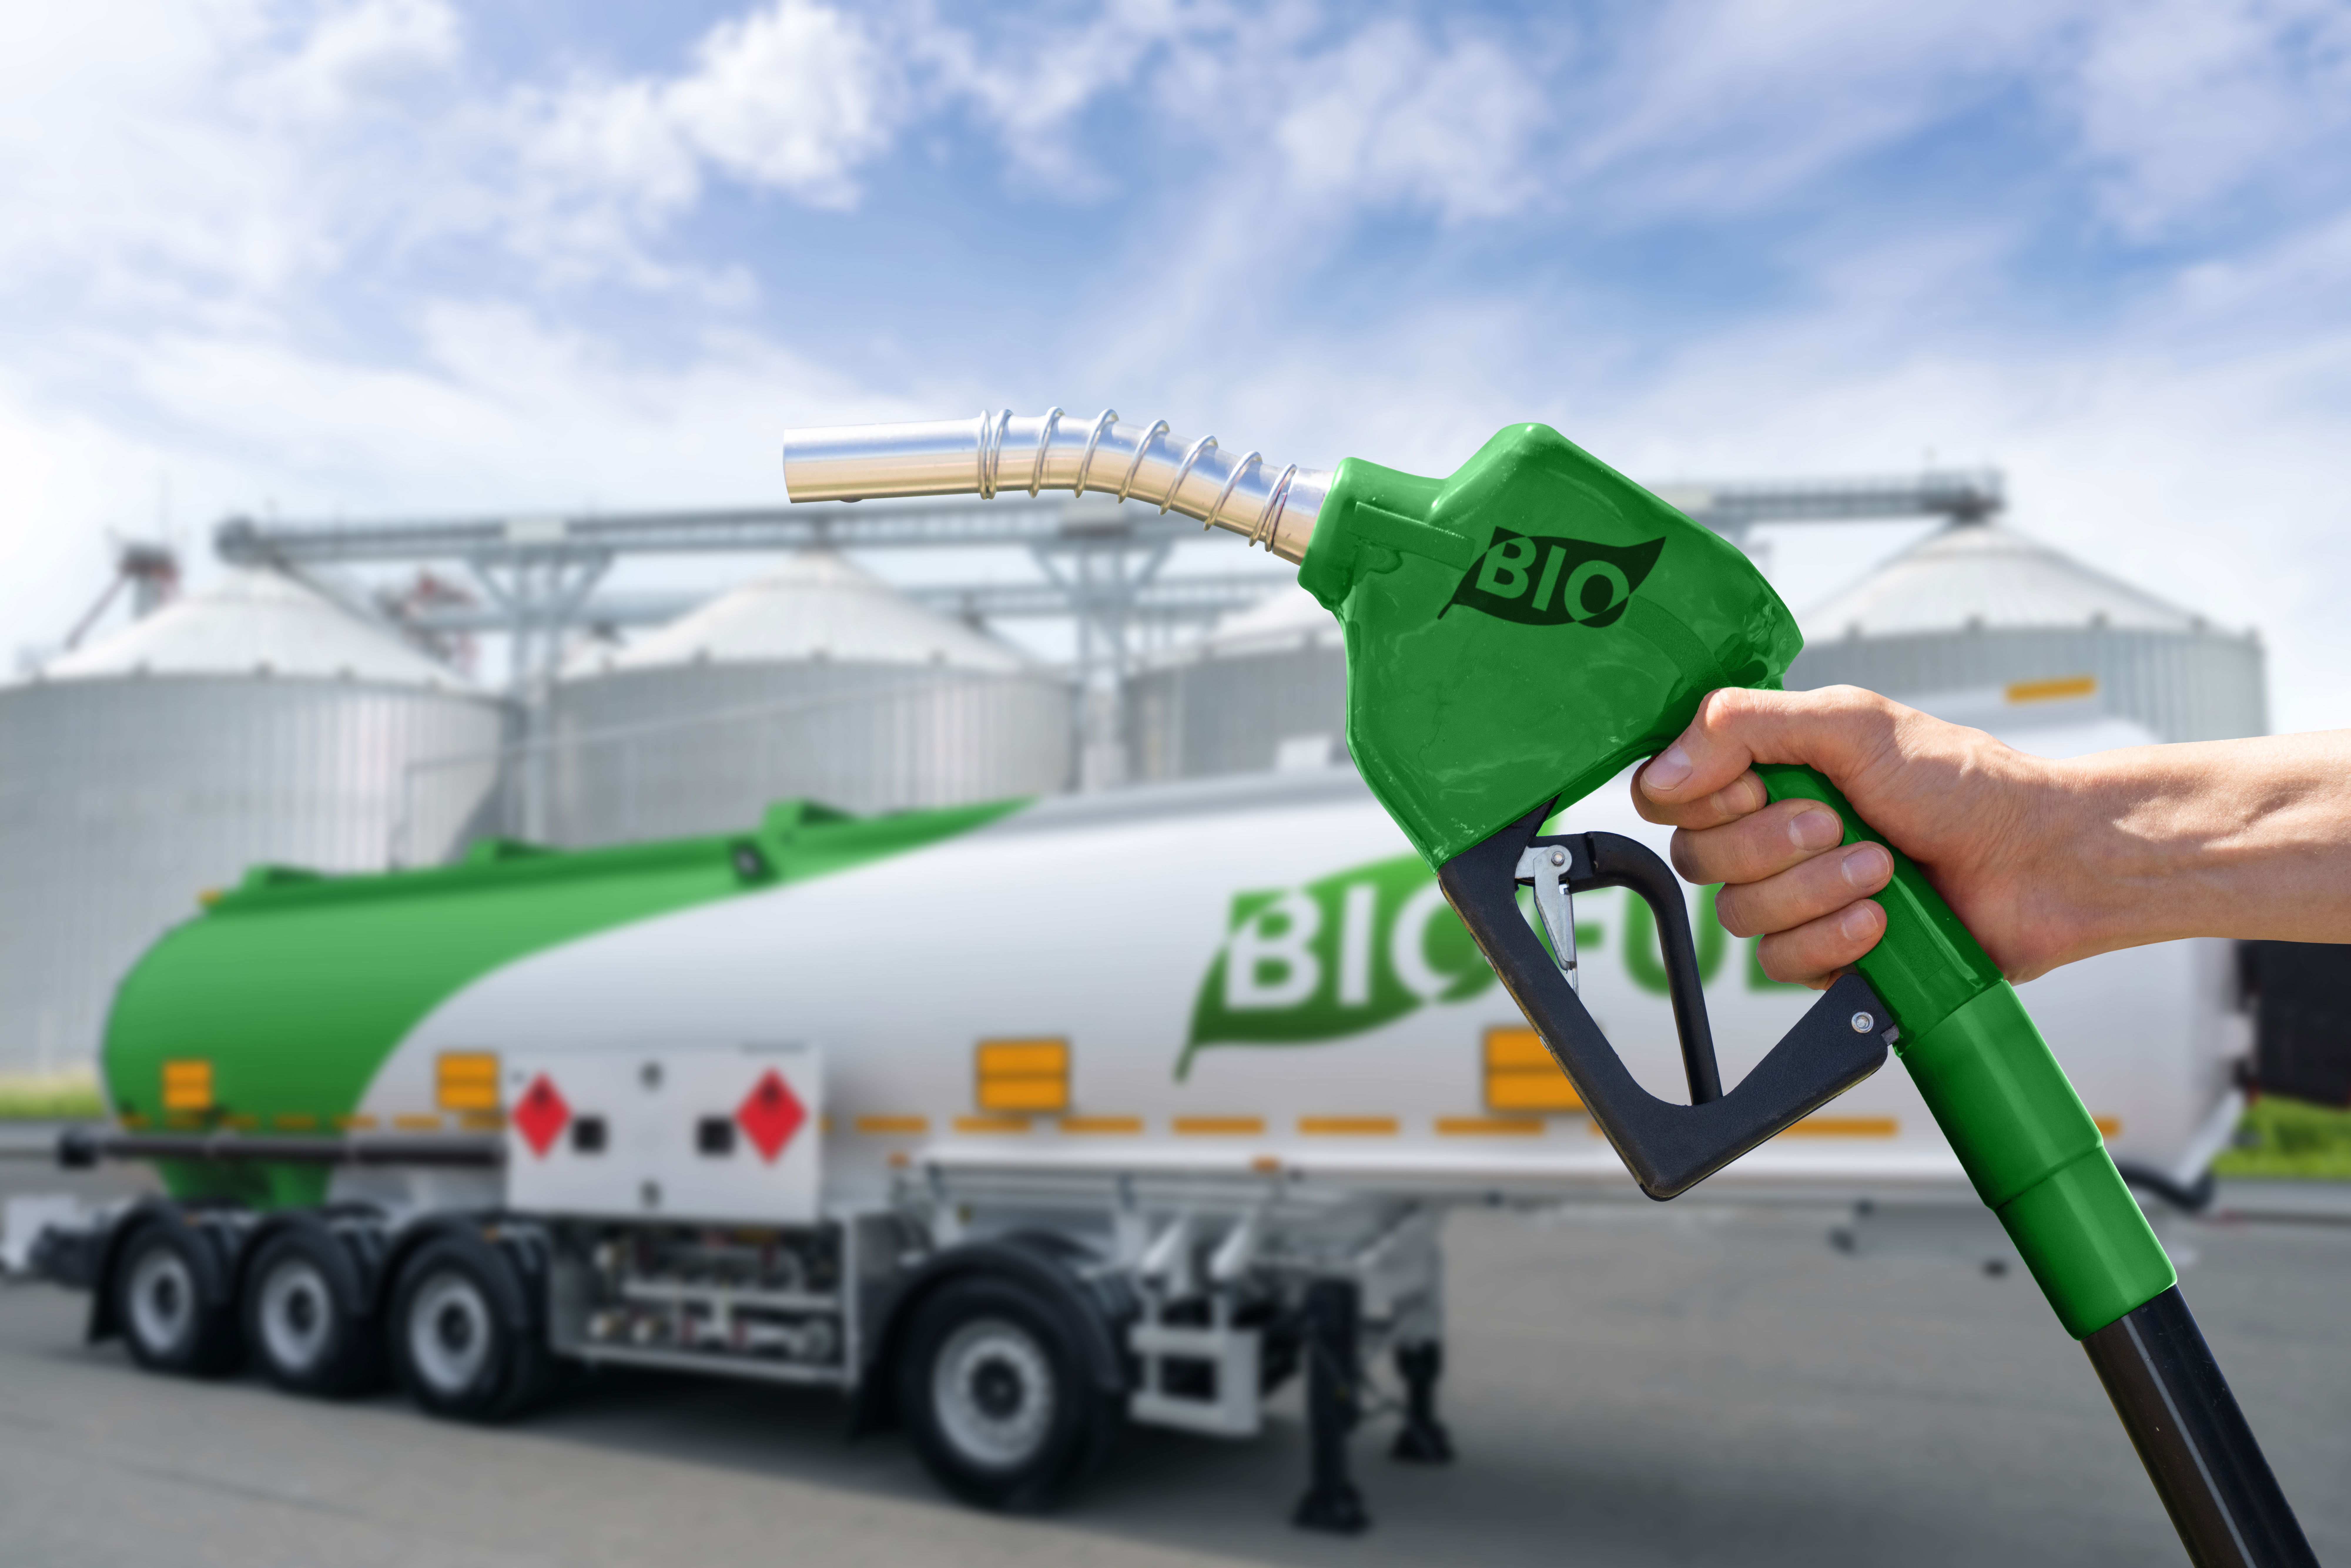
In a world racing toward cleaner, renewable energy sources, biofuels have emerged as one of the most promising alternatives to fossil fuels. Derived from organic materials like plants, algae, and animal waste, biofuels can power vehicles, heat homes, and even generate electricity — all while helping to reduce greenhouse gas emissions.
To truly understand how this green energy revolution works, it helps to visualize the biofuel production process diagram — a simple yet powerful illustration that breaks down how raw biomass is transformed into usable fuel. In this article, we’ll walk through every stage of that process, explain the science behind it, and show how the diagram of biofuel production ties together agriculture, chemistry, and sustainable technology.
What Are Biofuels?
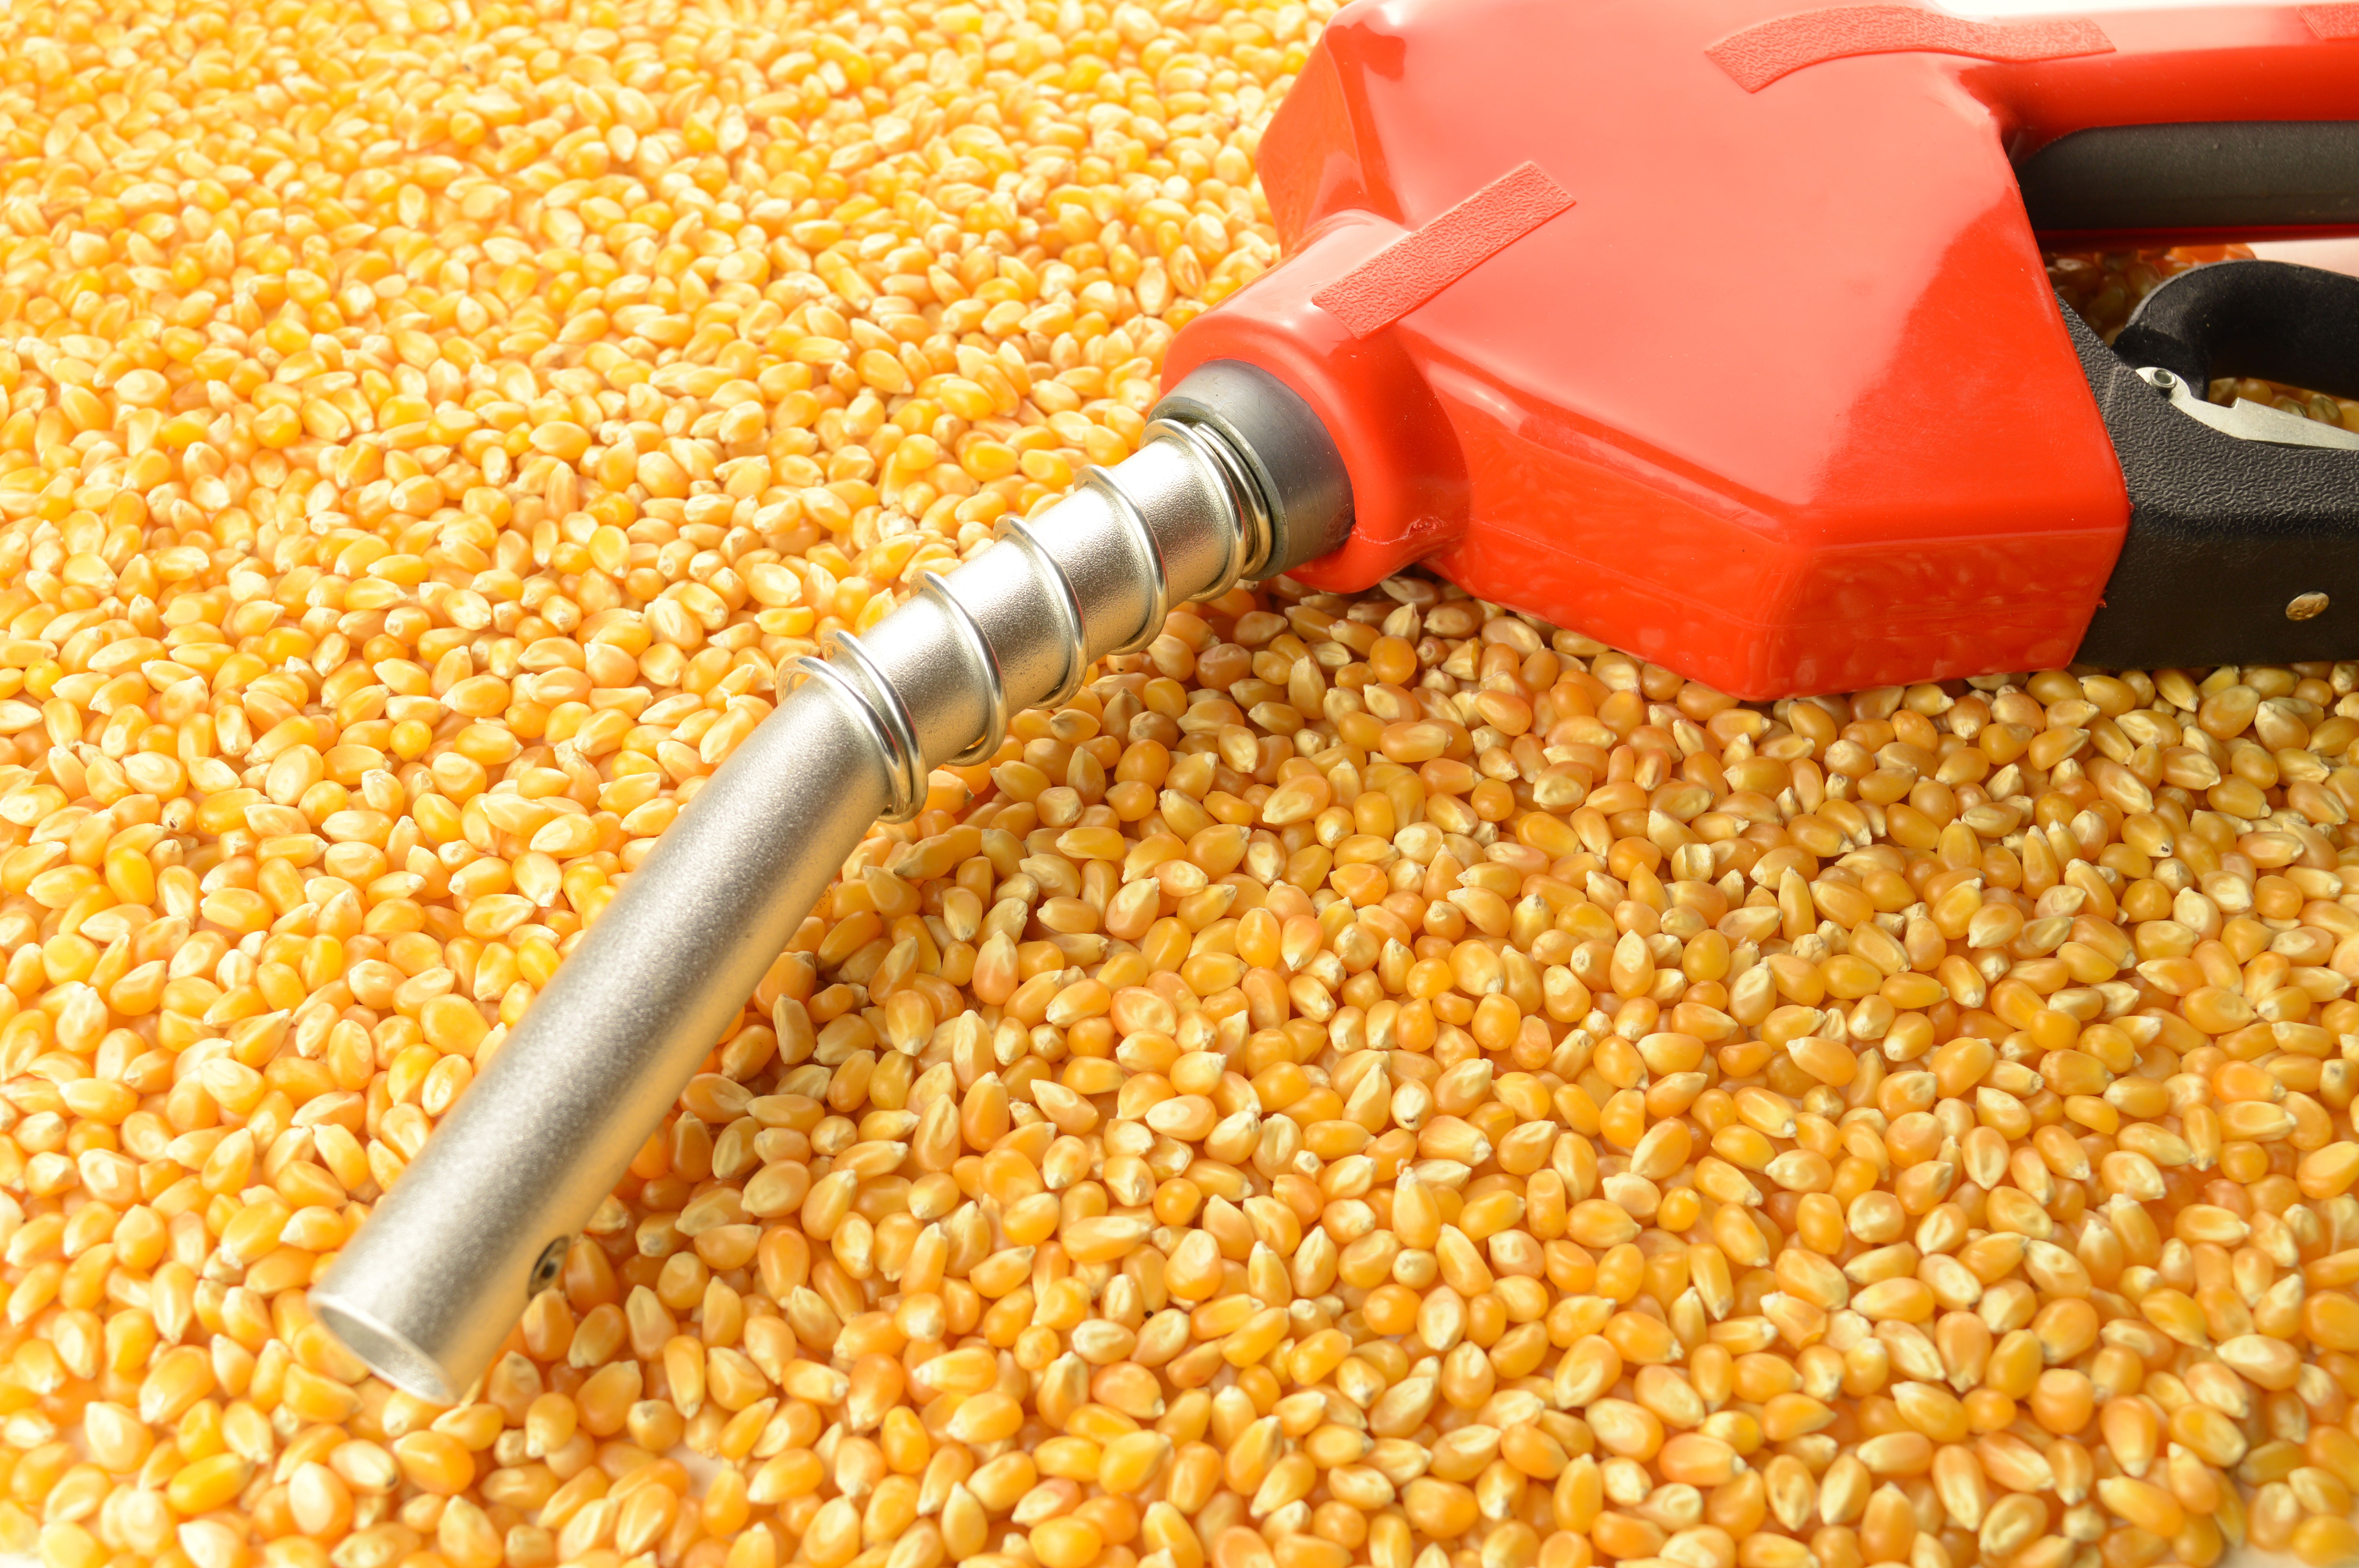
Biofuels are renewable fuels made from biological sources. The most common types are ethanol (a form of alcohol made from crops like corn and sugarcane) and biodiesel (produced from vegetable oils or animal fats). There are also advanced biofuels derived from algae or non-food plant materials, often referred to as second-generation or third-generation biofuels.
Unlike fossil fuels, which take millions of years to form, biofuels can be produced relatively quickly, making them a sustainable part of the global energy mix. Their production involves harnessing the stored chemical energy within organic matter — energy that was originally captured from sunlight through photosynthesis.
The Biofuel Process Diagram — A Simplified Overview
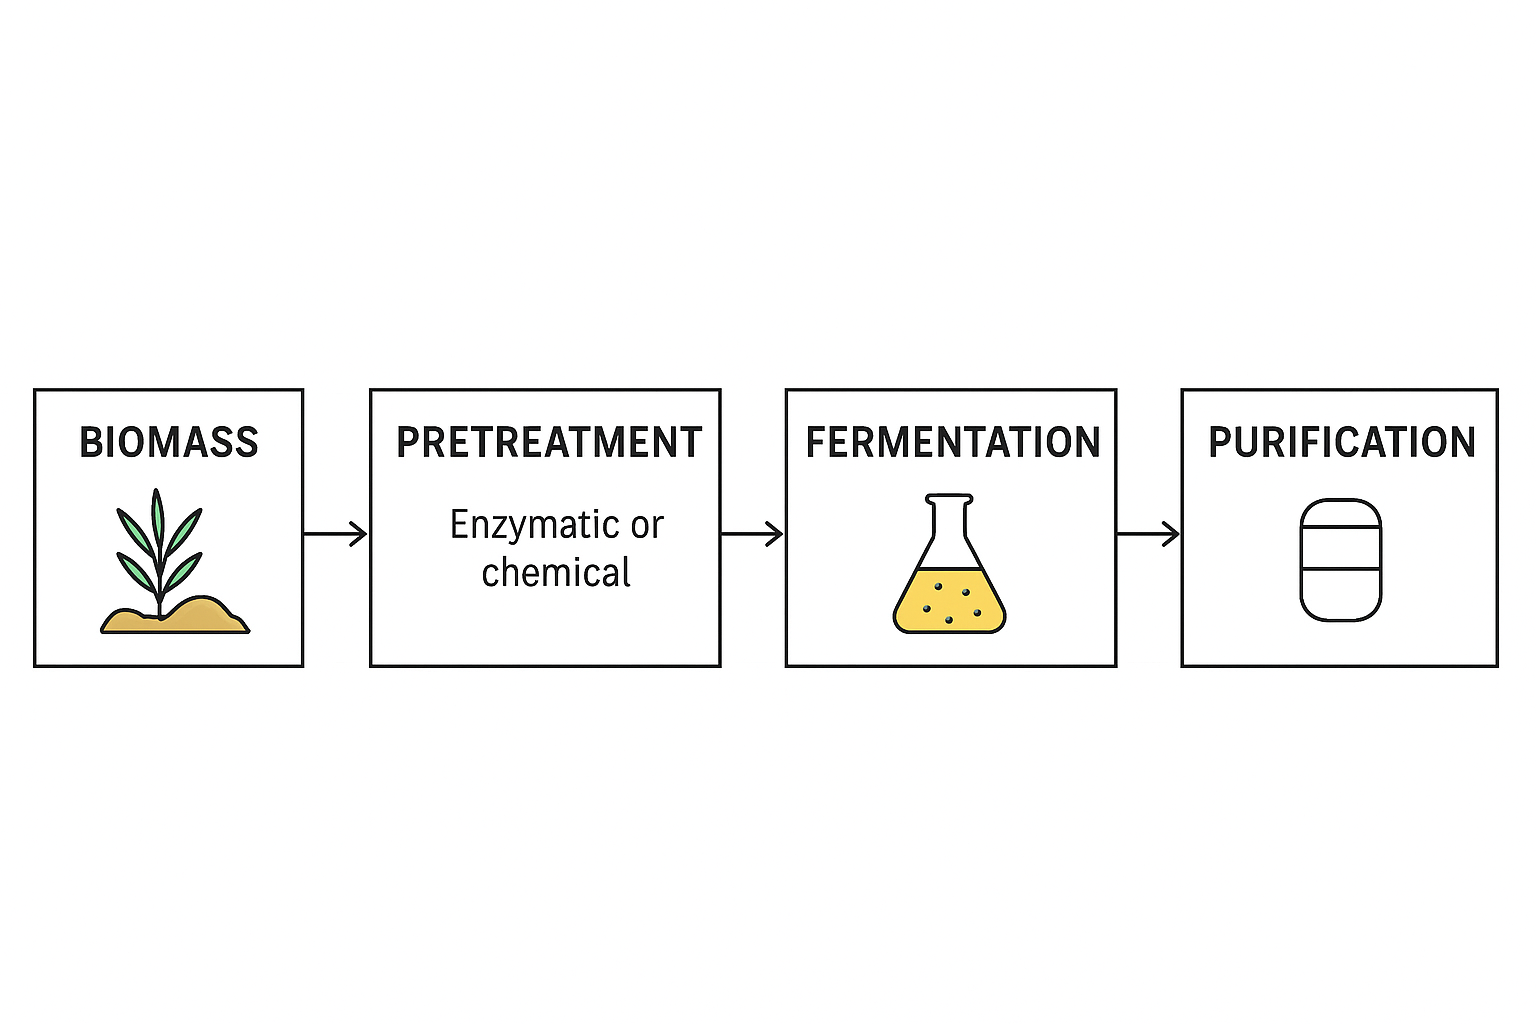
At its core, the biofuel process diagram simple version can be broken into five major stages:
- Feedstock cultivation and collection
- Pre-treatment and processing
- Conversion (chemical or biological)
- Refining and purification
- Distribution and usage
Each step in the biofuels process diagram represents a vital link in the chain that turns plants, waste, or algae into clean-burning fuel. Let’s explore these stages in detail.
1. Feedstock Cultivation and Collection
Every biofuel journey begins with biomass, also known as feedstock. This can include:
- Sugar-based crops (like sugarcane and sugar beet)
- Starch-based crops (like corn and wheat)
- Oil-based crops (like soybeans, rapeseed, and palm oil)
- Algae, which can produce large amounts of oil efficiently
- Waste materials, including agricultural residues, forestry byproducts, and even municipal solid waste
In the biofuels diagram, this stage is usually represented by agricultural fields, algae ponds, or waste collection systems. The key focus here is photosynthesis — plants absorb sunlight and carbon dioxide to create energy-rich biomass.
Modern biofuel producers are also turning to non-food feedstocks, helping to avoid competition with global food supplies. These include switchgrass, miscanthus, and cellulosic waste, which can be converted into advanced fuels without affecting food security.
2. Pre-Treatment and Processing
Once the raw material is collected, it must be prepared for conversion. This pre-treatment phase depends on the type of biofuel being produced:
- For ethanol, starches and sugars need to be broken down into fermentable sugars through enzymatic or acid hydrolysis.
- For biodiesel, oils and fats are extracted from the biomass using mechanical pressing or solvents.
- For cellulosic biofuels, tough plant fibers (cellulose and lignin) must be pre-treated using heat, steam, or chemicals to make them more accessible for conversion.
This stage is crucial because it determines how efficiently the biomass can be transformed later. In the biofuel process diagram simple, this step often appears as grinding, pressing, or heating icons — representing the mechanical and chemical breakdown of feedstock before it enters the conversion tanks.
3. Conversion — Turning Biomass into Biofuel
The conversion step is where chemistry and biology work together to transform raw biomass into usable fuel. In the diagram of biofuel production, this section often includes reactors or fermenters — the heart of the operation. There are two main conversion pathways:
A. Biological Conversion
Used mainly for bioethanol, this method involves fermentation.
- Enzymes convert starch or cellulose into sugars.
- Microorganisms like yeast or bacteria ferment the sugars, producing ethanol and carbon dioxide.
This process is similar to brewing beer — except instead of producing a drink, it yields a renewable fuel that can power cars and planes.
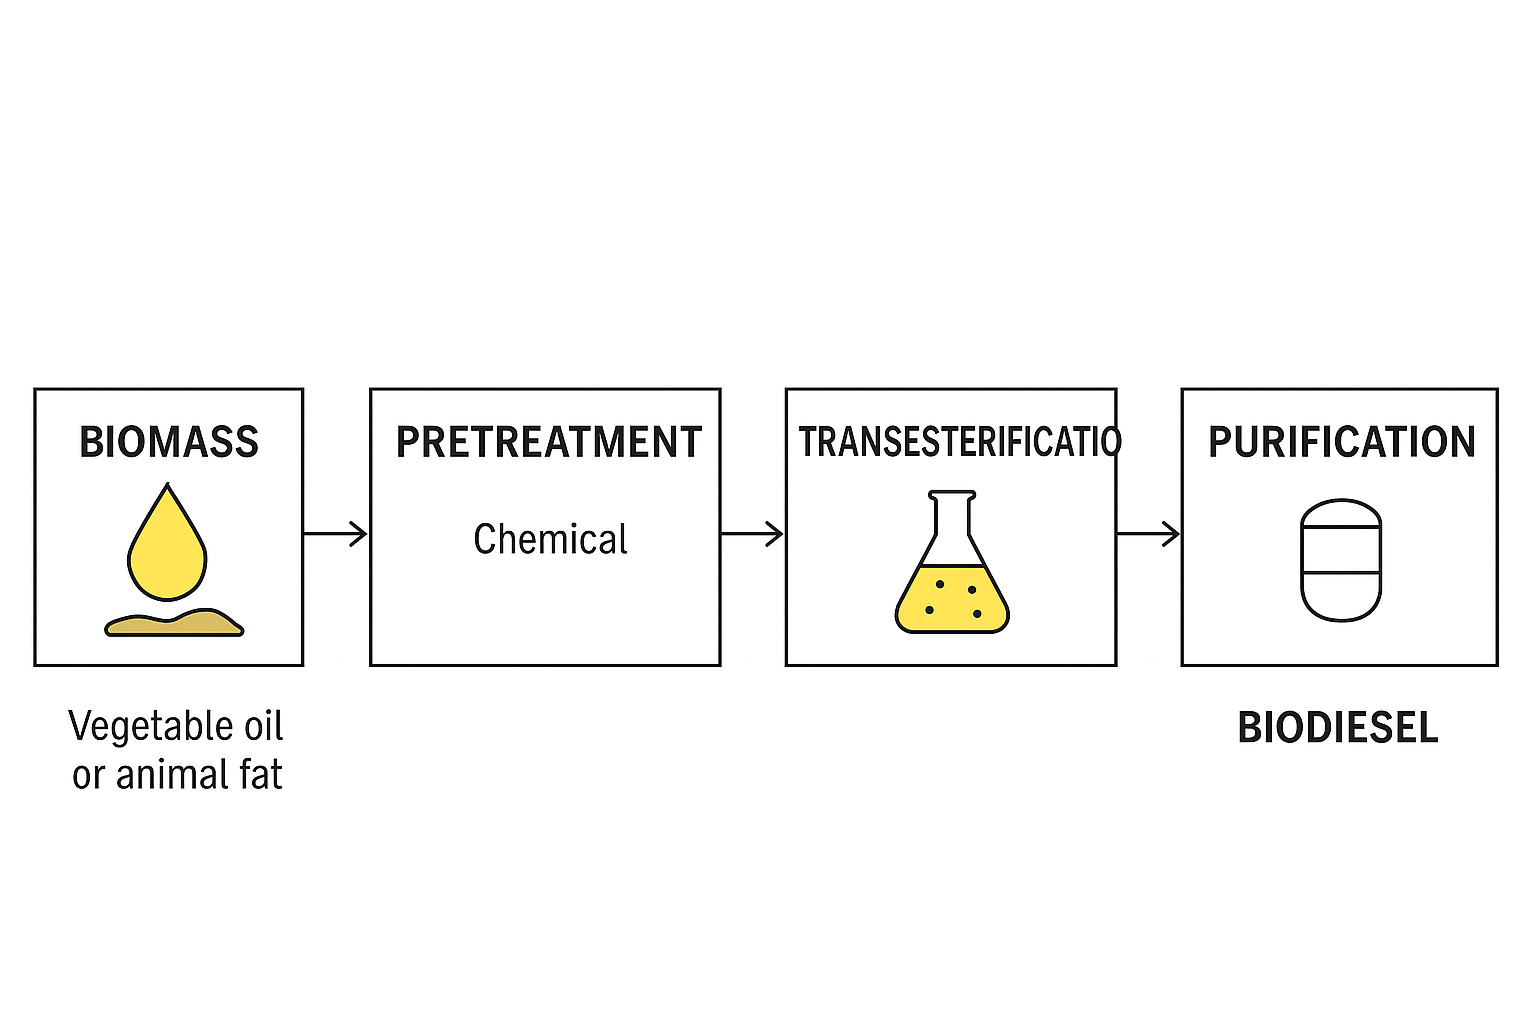
B. Chemical Conversion
This is the primary method for making biodiesel.
- Oils or fats react with alcohol (usually methanol) in a process called transesterification.
- A catalyst, such as sodium hydroxide, helps produce biodiesel and glycerin as a byproduct.
In the biofuels process diagram, this chemical reaction stage is often represented by arrows leading from feedstock to refined fuel, illustrating how organic oils are transformed into energy-dense molecules.
4. Refining and Purification
Once conversion is complete, the crude biofuel must be refined and purified to meet quality and safety standards. This step removes impurities like water, glycerin, and unreacted materials. For ethanol, distillation separates the alcohol from the fermentation broth.
For biodiesel, washing and drying processes ensure the final product burns cleanly and won’t damage engines. In a diagram of biofuel energy, this stage is often shown as distillation columns or filtration units, symbolizing the purification phase that brings the product up to usable standards.
5. Distribution and Usage
The final stage in the biofuels diagram simple format shows the purified fuel being distributed and used. Biofuels can be:
- Blended with traditional fuels (e.g., E10 or B20 blends, meaning 10% ethanol or 20% biodiesel)
- Used directly in compatible engines
- Converted into bio-based jet fuels or renewable diesel
In the diagram of biofuels being used, you might see fuel pumps, vehicles, or even aircraft icons — illustrating how the biofuel finally enters the energy cycle to power movement and industry.
The Science Behind the Biofuel Energy Diagram
The diagram of biofuel energy does more than just illustrate production — it represents a complete energy cycle that begins and ends with carbon.
- Carbon Capture – During growth, plants absorb CO₂ from the atmosphere.
- Energy Conversion – This stored solar energy is converted into chemical energy through photosynthesis.
- Fuel Production – Biomass is processed into usable liquid fuels.
- Energy Release – When biofuels are burned, CO₂ is released again — but it’s the same carbon previously captured, creating a closed carbon loop.
This is what makes biofuels a carbon-neutral or near-carbon-neutral energy source, depending on how efficiently they’re produced.
The Importance of a Biofuel Process Diagram in Education and Industry
Having a biofuels process diagram helps students, researchers, and energy professionals visualize the complex chain of reactions that turn plants into power. For example:
- Educators use the biofuel process diagram simple version to explain renewable energy cycles in classrooms.
- Engineers and researchers use detailed diagrams to optimize efficiency and minimize waste in real-world production.
- Policymakers and investors rely on these visual tools to understand where technological advancements can reduce costs or emissions.
Essentially, these diagrams bridge the gap between science and practice, making the green energy revolution more tangible and understandable.
Challenges in Biofuel Production
While the diagram of biofuel production may appear smooth and straightforward, the actual process faces several real-world challenges:
- Feedstock limitations – Growing crops for fuel can compete with food production and water use.
- Energy balance – Some biofuels require significant energy input during processing, reducing their net environmental benefit.
- Land use changes – Deforestation and monocropping for biofuel crops can offset carbon savings.
- Economic viability – Production costs can be high, especially for advanced biofuels like algae-based fuels.
However, innovation continues to address these challenges through better crop genetics, improved conversion technologies, and integration with waste management systems.
The Future of Biofuel Technology
The next phase of the biofuel revolution focuses on advanced and synthetic biofuels — those made from non-food biomass or even directly from captured CO₂.
- Algae-based biofuels offer high yields without competing for farmland.
- Cellulosic ethanol turns agricultural waste into energy instead of letting it rot.
- Biogas and renewable diesel are helping industries and cities decarbonize heavy transport.
Governments and automakers are investing heavily in these next-gen fuels. For instance, airlines are adopting sustainable aviation fuel (SAF) — a bio-based jet fuel that can cut emissions by up to 80%.
In the coming decade, the biofuels process diagram will evolve, incorporating carbon capture, artificial photosynthesis, and hybrid systems that blend bioenergy with hydrogen or solar power. The result: cleaner, smarter, and more efficient renewable fuels.
Final Thoughts
Understanding the biofuel process diagram isn’t just an academic exercise — it’s a window into how humanity can power the future without destroying the planet. From the first seed planted in the soil to the final drop of fuel in a tank, every step of the biofuels diagram represents innovation, sustainability, and the pursuit of balance between energy and ecology.
So, the next time you see a diagram of biofuel production or a diagram of biofuel energy, remember — it’s more than arrows and tanks. It’s the blueprint for a cleaner, renewable, and circular energy economy that may define the 21st century.
Comments